Where Might Soybean Acres Change?
The combination of several years of outstanding crops and the trade dispute with China have pushed U.S. soybean stocks to record levels (and near record levels relative to use). Given this situation, it is likely soybean acres will decline from last year. Although current market prices are not providing an overwhelming signal for producers in states such as Indiana to switch from beans, we wondered where changes might occur in 2019.
Who are the Players?
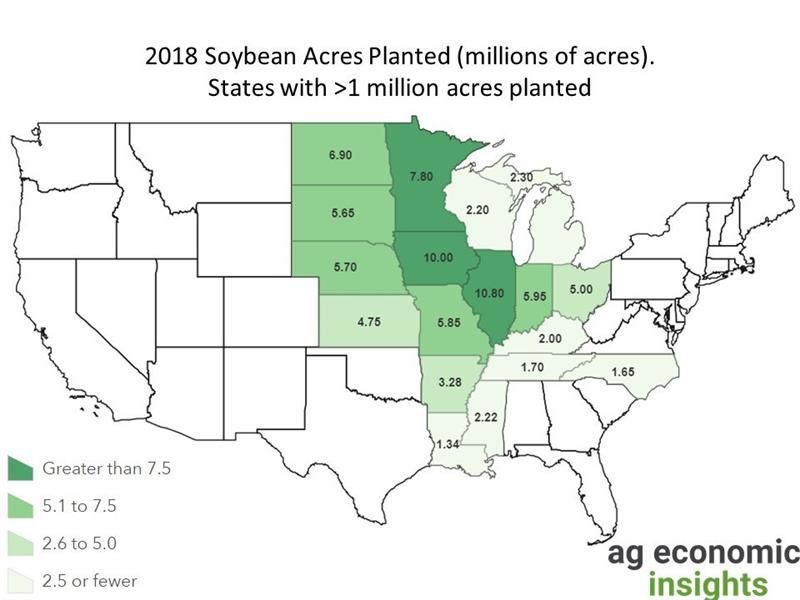
The geographic coverage of soybeans has increased in recent years with acres increasing both to the North and West of the traditional U.S. corn belt. Nine states planted in excess of 5 million acres of beans in 2018. Ranked by magnitude they are IL, IA, MN, ND, IN, MO, NE, SD, and OH. However, there were 9 additional states that planted over 1 million acres of soybeans in 2018. Together, these 18 states accounted for 95% of the soybeans planted in the U.S. It is likely that most of the acreage adjustment will come from these states.

Figure 1. Soybean Production by State, 2018.
How Much Change Goes on from Year to Year?
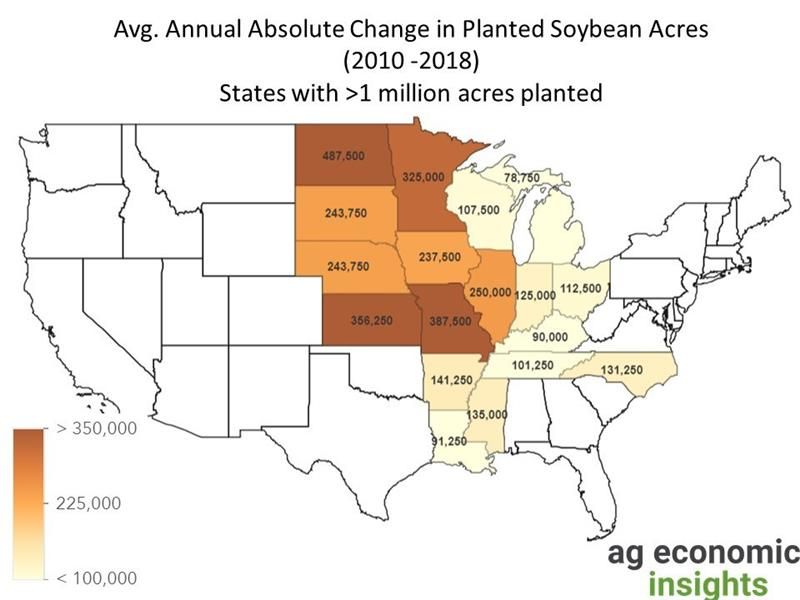
We examined planting data in these states from 2010 to 2018. Over this time period, several of the states made some very large annual changes in acreage. We summarized these by looking at the average of the absolute value of annual changes in acreage in each state. We used the absolute value to treat either an increase or a decrease the same. The average annual changes in each state are shown in Figure 2.
Figure 2. Average of the Absolute Value of Annual Change in Soybean Acreage, 2010-2018.
One of the things noticeable about this map is that states with large average changes were generally outside of the traditional corn belt. For instance, North Dakota, Missouri, Kansas had the largest average change. North Dakota’s average change was 487,000 acres. This is in contrast to Indiana which had an average annual change of just 125,000 acres. North Dakota and Indiana are roughly comparable in soybean production area with North Dakota planting nearly a million more soybean acres in 2018. The largest production states of Illinois and Iowa also showed relatively modest amounts of switching over this time period.
In terms of the absolute magnitude of changes, North Dakota, Missouri, and Kansas have all seen acreage swing in excess of 1 million acres in a given year. Interestingly, all of these changes were year over year increases. Only 1 state, Missouri in 2015 has ever recorded a year over year decline in soybean acreage in excess of 1 million acres. To get a better feel for how soybeans might shift at the county level take a look at this post David wrote in 2015.
Wrapping it Up
The current planting situation is surrounded by a lot of uncertainty. A great deal of this uncertainty is related to trade and the ultimate level of soybean stocks. At present it is likely that soybean acreage will decline in the U.S. As we look at soybean acreage, the largest players are clearly in the corn belt. However, it is also important to remember that there are several states on the periphery of the traditional corn belt that have become major soybean producers.
A fair amount of the acreage adjustment will likely come from the Corn Belt states, just because they grow the most acres of beans. However, states such as North Dakota, Kansas, and Missouri all grow considerable numbers of soybean acres as well. These states have also shown a tendency for larger acreage swings. It is likely that this will be the case again 2019. However, it is also important to note that soybean acreage has been on a general uptrend in the U.S. and many of these states have a lot more experience with increasing soybean acres than they do decreasing them. It is going to be interesting to see how producers react to this environment of elevated soybean stocks.
Source: Brent Gloy, Agricultural Economic Insights

