U.S. Dairy Consumption Trends in 9 Charts
The recent bankruptcies of dairy processors Dean Foods and Borden Dairy highlighted challenges within the dairy industry. Downward trends in dairy consumption, mainly milk, was frequently cited as a significant factor. In light of all this, this week’s post is a look at U.S. dairy consumption trends.
Trending Higher – Butter and Cheese
Figure 1 shows the U.S. annual per capita consumption of butter. After more than three decades between 4 and 5 pounds, consumption exceeded 5 pounds in 2011. In 2018, the USDA reported consumption at 5.8 pounds per person. Compared to 2001, when butter consumption was at a low of 4.3 pounds per person, per capita consumption in 2018 was 33% higher, increasing at an average annual rate of 1.6%
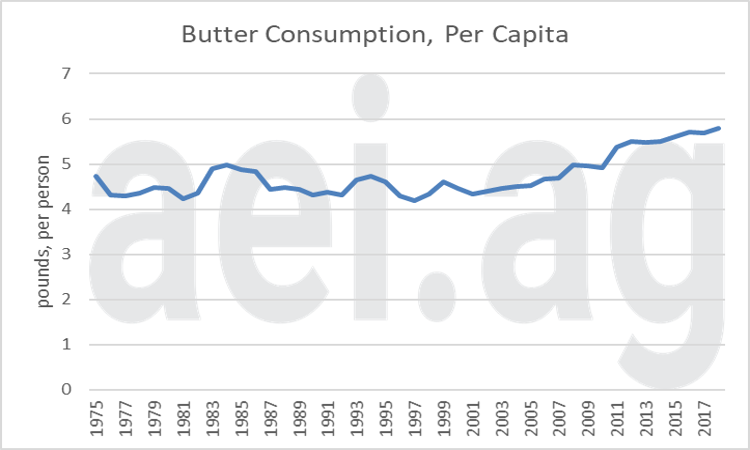
Figure 1. U.S. Consumption of Butter, Per Capita. 1975-2018. Data Source: USDA ERS.
Another bright spot for dairy has been cheese consumption (Figure 2). Since 1975, annual consumption has increased from 20 pounds per person to 40 pounds in 2018. The doubling in nearly 45 years is equal to a 1.7% average annual rate of increase.
Cheese is admittedly a broad category. Figure 3 breaks down 2018 U.S. cheese consumption. First, there are two major categories of cheese reported by the USDA: American cheese[1] (shown in shades of blue) and Italian cheeses (in shades of green). These two categories each accounted for 41% of the cheese consumed. Within the broad categories, mozzarella (32%) was the most popular, edging out the cheddar cheeses (30%).
Figure 4 shows the cheddar versus mozzarella battle since 1995. Before 2000, cheddars were the most popular. Since 2010, however, mozzarella has maintained the lead.
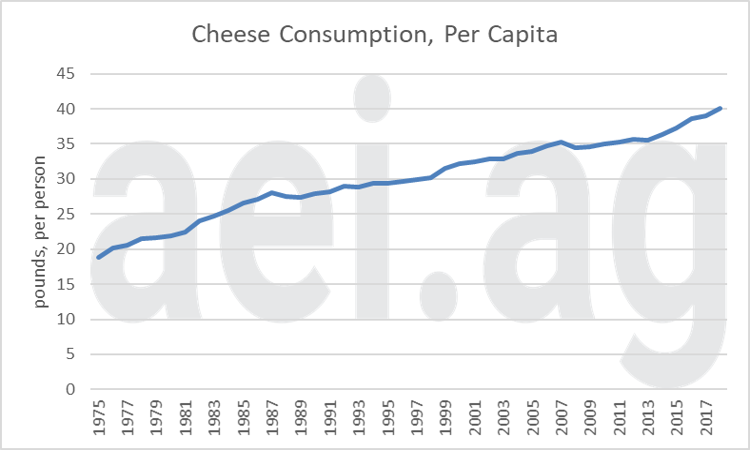
Figure 2. U.S. Consumption of Cheese, Per Capita. 1975-2018. Data Source: USDA ERS.
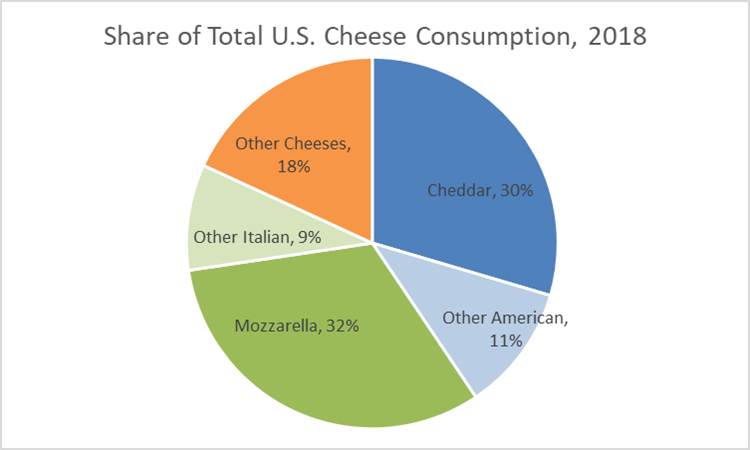
Figure 3. U.S. Consumption of Butter, Per Capita. 1975-2018. Data Source: USDA ERS.
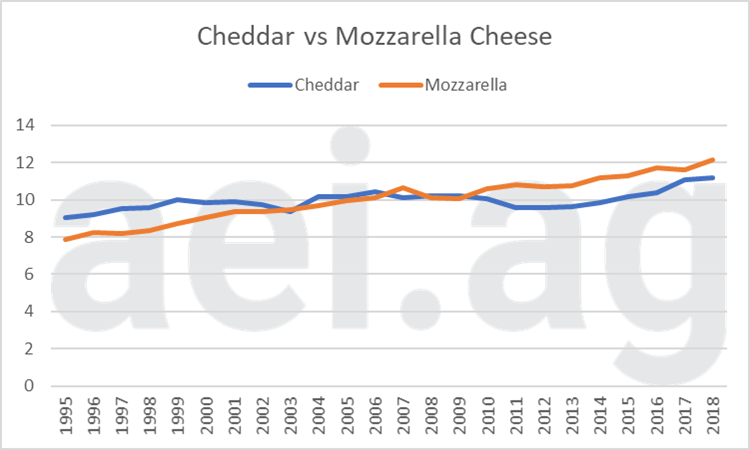
Figure 4. U.S. Consumption (per capita) of Cheddar and Mozzarella Cheese, 1996-2018. Data Source: USDA ERS.
Trending Lower- Fluid Milk, Yogurt, Ice Cream
Perhaps the most cited U.S. consumer trend chart is the per capita consumption of fluid milk (figure 5). It is dramatic. Since 1975, Americans have reduced consumption by more than 40% (247 pounds in 1975 to 146 pounds in 2018). The decline is equal to a 1.2% average annual rate of decline. While that rate is not necessarily large, the persistence of the decline over nearly five decades is most significant.
Adding another layer to shifting consumer preferences, figure 6 shows annual fluid milk sales of the four largest categories. Before 2009, the trend had been less whole milk, more 2% (especially before the 1990s), more 1%, and more skim milk (especially during the 1990s). However, over the last decade, these trends have flipped. Whole milk sales have turned higher for the first time in decades. Furthermore, sales of 2%, 1%, and skim milk have all contracted.
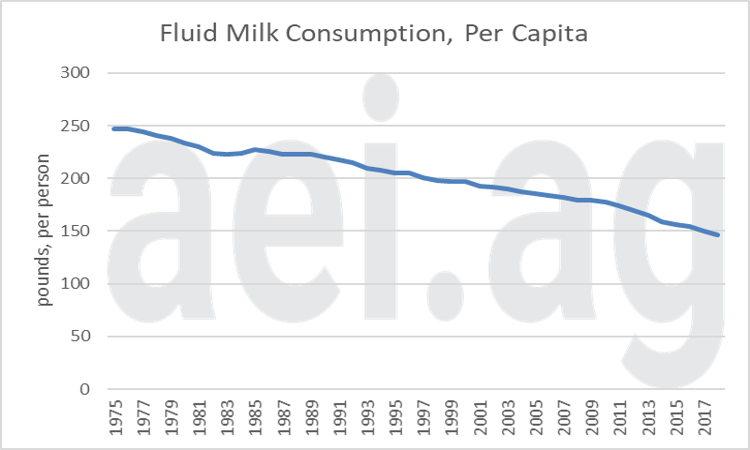
Figure 5. U.S. Consumption of Fluid Milk, Per Capita. 1975-2018. Data Source: USDA ERS.
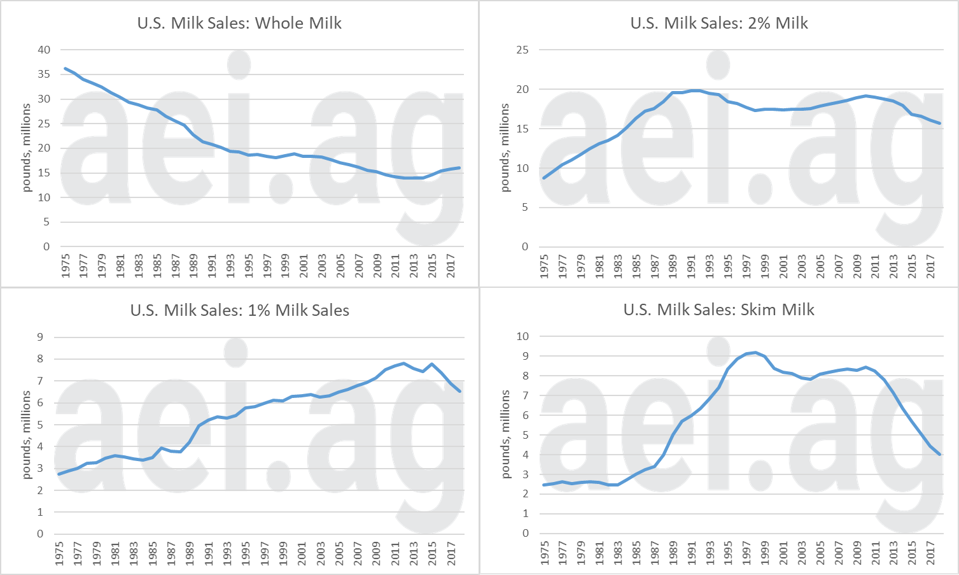
Figure 6. U.S. Fluid Milk Sales, by Type (Whole, 2%, 1% Skim). 1975-2018. Data Source: USDA ERS.
Figure 7 captures the decline in per capita ice cream consumption. The change has been mostly limited to ‘regular’ ice cream, declining from 18 pounds annually to less than 12. Reduced-fat ice cream, with steady consumption over time, has been mostly immune to declines.
Another dramatic observation in dairy consumption has been the recent about-face in yogurt. After decades of steadily increasing per-capita consumption (at an average rate of 5.2% from 1975 to 2014), yogurt consumption has contracted in the last five years. Specifically, annual per capita consumption fell from 14.9 pounds per person (2014) to 13.5 pounds (2018).
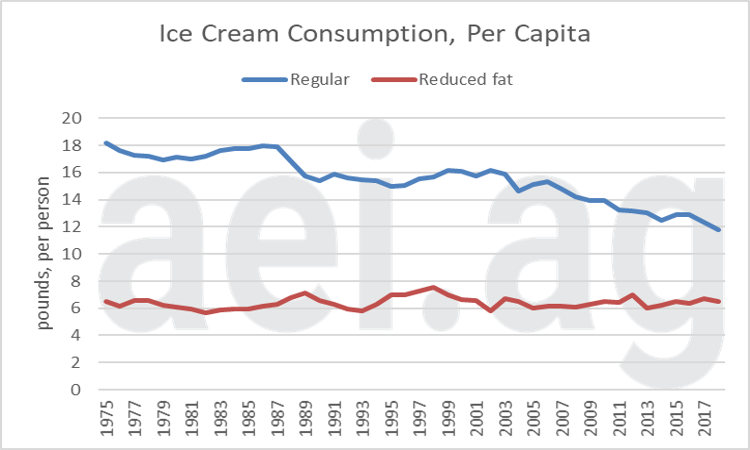
Figure 7. U.S. Consumption of Ice Cream, Per Capita. 1975-2018. Data Source: USDA ERS.
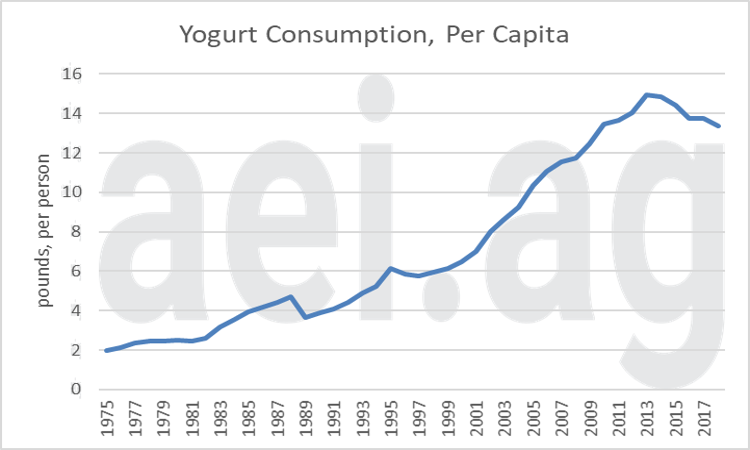
Figure 8. U.S. Consumption of Yogurt, Per Capita. 1975-2018. Data Source: USDA ERS.
The Big Picture
While consumption trends have varied across specific dairy products, it is worth considering overall, total dairy consumption. In figure 9, the total per capita dairy consumption of dairy, on a milk-fat milk-equivalent basis, is shown. These data account for the milk-fat content of each dairy products and provides a measure of how many total pounds of milk (based on milk-fat) are consumed. In other words, this measure is a way of aggregating up dairy consumption across all products (butter, yogurt, etc.).
Total per capita dairy consumption in the U.S. can vary from year to year, but since the mid-1990s, the trend has been higher. Although consumption has plateaued in recent years, consumption in 2018, the most recent data point, is the highest since 1975.
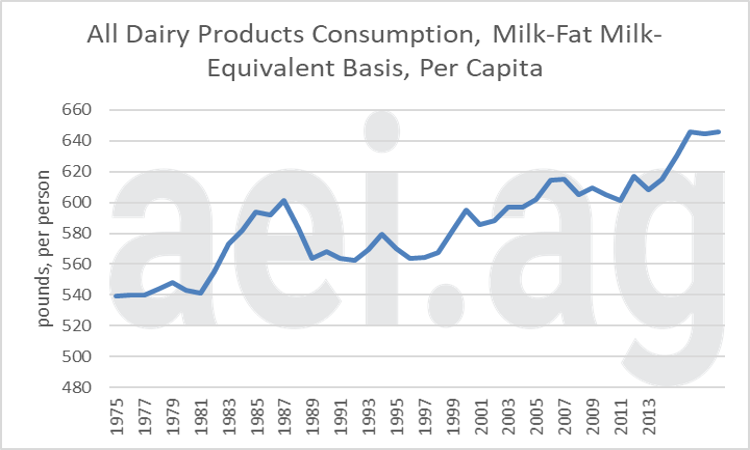
Figure 9. U.S. Consumption of All Dairy Products, Milk-Fat Milk-Equivalent Basis, Per Capita. Pounds per Person. 1975-2014. Data Source: USDA ERS.
Wrapping it Up
Trends come in all shapes and forms. In some cases, trends can be easily overlooked because they are slow rates of change that play out over decades. On the other hand, consumption trends can also abruptly change. Yogurt is an example of both; decades of momentum suddenly contracting.
Overall, the dairy industry is primarily driven by slow rates of changes unfolding over several decades. Over nearly 40 years, per capita consumption has trended higher for butter and cheeses. At the same time, the consumption of fluid milk and ice cream has trended lower. Overall, however, the consumption of all dairy products has trended higher. As consumer trends continue to unfold, expect even more changes in the supply chain: grocery store displays, processing, and, eventually, at the farm-level.
Click here to subscribe to AEI’s Weekly Insights email and receive our free, in-depth articles in your inbox every Monday morning.
You can also click here to visit the archive of articles – hundreds of them – and to browse by topic. We hope you will continue the conversation with us on Twitter and Facebook.
[1] American cheeses are Cheddar, Colby, Monterey, and Jack (http://www.ers.usda.gov/media/146945/ldpm19301_1_.pdf).
Source: David Widmar, Agricultural Economic Insights
