The Farm Economy Slow Down-Commodity-level Impacts
A few weeks ago we considered the state-level impacts of the farm economy slow down. While net farm income has fallen 42% nationally, the impacts have varied across the country. As many would expect, the Corn Belt and Great Plains states were hard-hit. Based on reader feedback, this week’s post considers the farm economy slow down across commodities.
Farm Cash Receipts
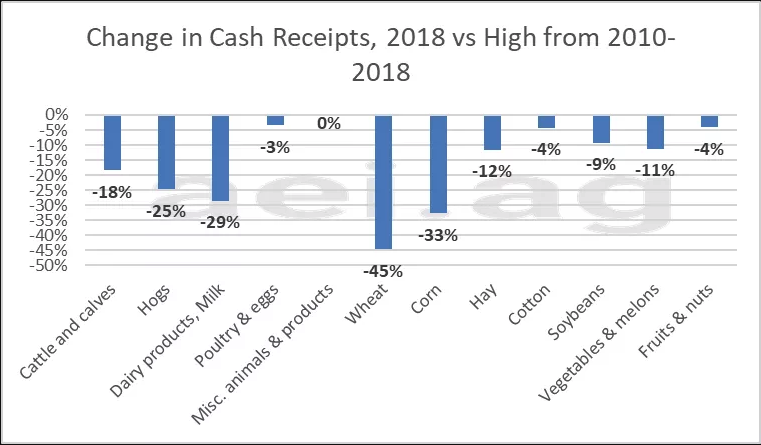
Figure 1 shows the difference in cash receipts for 2018 compared to the high observation from 2010 and 2018. This measure is one way of considering how significant the farm economy slow down has varied. As we have noted in several posts (here and here), conditions for wheat production has been particularly challenging. Cash receipts in 2018 were 45% lower than the highs observed in 2012. It is worth noting that wheat cash receipts in 2018 are actually 5% higher than the lows reached in 2017.
Corn has also experienced a large decline with cash receipts down one-third from 2012 highs. Outside of crops, livestock producers have also been hard-hit. Cash receipts for cattle and calves (-18%), hogs (-25%) and dairy (-29%) have faced significant declines from 2014 highs.
Perhaps the data-point that stands out the most is soybeans with only a 9% drop in cash receipts from the highs. Keep in mind that these data are cash receipts- or a measure of annual sales. It will take some time for the full impact of the decline in soybean prices in 2018 to work its way into the data. Furthermore, changes in these data are driven by price and quantity. More on that later.

Figure 1. Change in Cash Receipts, 2018 vs. High from 2010-2018. Data Source: USDA’s ERS.
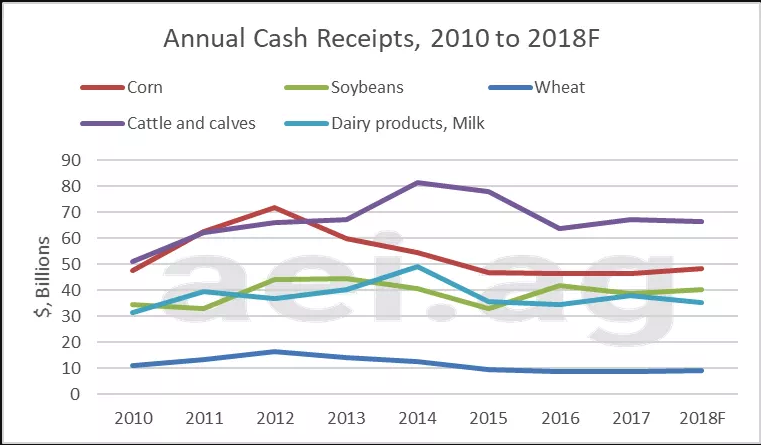
Figure 2 shows annual cash receipts from 2010 to 2018 for select commodities. For corn, soybeans, and wheat, cash receipts peaked in 2012. For livestock, cash receipts peaked later, in 2014.
In recent years, cash receipts have been stable for several commodities. For example, cash receipts for cattle and calves, corn, and wheat have been mostly sideways since 2016. However, two commodities have trended lower in recent years, soybeans and dairy. The continued slide for these commodities makes current financial conditions and 2019 increasingly challenging.
Figure 2. Annual Cash Receipts – Corn, Soybeans, Wheat, Cattle and Calves, Dairy products (Milk). 2010 -2018. Data Source: USDA’s ERS.
Field-Level Impacts
While the data presented in figures 1 and 2 are informative, they are not a perfect measure of farm-level conditions. Specifically, changes in area planted has a large impact on annual cash receipts. Soybean production, for example, has increased by more than 12 million acres over the last nine years. The increased production has masked declining field-level economics.
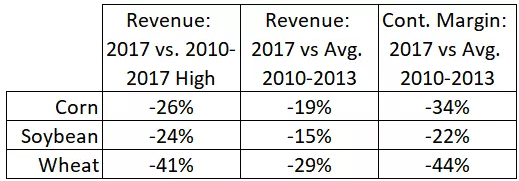
Table 1 uses USDA data that considers acre-level revenue and returns for corn, soybeans, and wheat. Specifically, the data considered were 2010 to 2017 (2018 data are not yet available). Furthermore, these data are national averages.
The first column shows the difference in per-acre revenue comparing 2017 to the high from 2010 to 2017. Wheat, again, was hardest hit with a 41% decline in per-acre revenue. The acre-level impact for corn and soybeans, however, is much closer than shown in figures 1 and 2. Specifically, corn revenue in 2017 was 26% lower than the earlier high, while soybean revenue was 24% lower.
The middle column shows the change in revenue for 2017 compared to the average per-acre revenue from 2010 to 2013.
Finally, the last column considers the contribution margin. Contribution margin is the difference between revenue and variable costs of production (such as seed, fertilizer, chemicals, etc.). Hired labor, depreciation, and land – to list a few- are not included. Contribution margin is a helpful measure as it shows how much remains to cover fixed, overhead expenses and generate a profit (if sufficient).
For corn, the contribution margin in 2017 was 34% less than the average of 2010 to 2013. As an example, this measure tells us there is now only $64 of contribution margin – to cover fixed expenses and generate a profit – for every $100 of contribution margin there was between 2010 and 2013.
Again, the impacts were most dramatic for wheat with a 44% decline in contribution margin. Soybeans have also shown a significant decline, contracting 22%.

Table 1. Changes in Revenue and Contribution Margin- Corn, Soybeans, Wheat. Data Source: USDA ERS.
Wrapping it up
As we noted in an earlier post, it can be difficult to capture and articulate the impacts of the current farm economy slowdown. In many cases, data that captures farm-level impacts and conditions can be challenging -if not impossible- to capture.
Commodity cash receipts are important and helpful measures. Furthermore, these data are frequently updated. Cash receipts have captured sharp declines and significant challenges for producers of wheat, corn, cattle and calves, hogs, and dairy. However, recent data have understated the challenges for soybean production, which has increased acres even with significant revenue and contribution margin declines.
Finally, it’s important to keep in mind that producers can, in some cases, pursue alternatives. When conditions in wheat were most severe and bleak, many producers had the option to plant alternatives. This is why wheat production contracted by morethan 9 million acres in two years. Conversely, producers of livestock have very few alternatives they can pursue. An investment in a dairy facility and production isn’t easily switched to hog or cow-calf production. This is to say that, in some cases, producers were able to adjust production to pursue less-bad options. In other cases, producers had limited options when managing the downturn.
Source: David Widmar, Agricultural Economic Insights

