Is the World More Reliant on Ag Trade?
We previously took a look at global trends in ag trade and considered how much trade contributed to total global corn, soybean, and wheat consumption. Two observations were that 1) reliance on ag trade was different for each crop, and 2) a crop’s reliance on trade varied over time. While the earlier post considered the three crops independently, it left us wondering about the collective impact across all major crops.
Which Crops are Most Reliant on Trade?
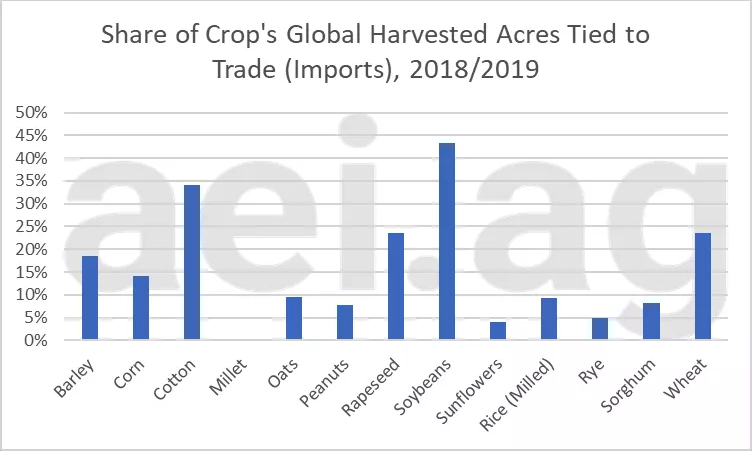
To examine which crops were more reliant on trade we converted global imports for each of the thirteen primary crops to an acre equivalent[1]. The conversion was done by dividing annual total global imports by the average annual yield. This measure shows the share of the crop’s annual harvested acres were reliant on trade.
Figure 1 shows these data for the 2018/2019 marketing year. The first observation is that the world relies on global trade at very different levels across the thirteen crops. For soybeans (43%), cotton (34%), rapeseed (24%), and wheat (24%), trade (imports) account for a large share of annual production (harvested acres). Rye (5%), sunflowers (4%), and millet (0%) are much less reliant on trade.
Figure 1. Share of a Crop’s Global Harvested Acres Tied to Trade (Imports), 2018/2019. Data Source: USDA’S PSD Database.
In total
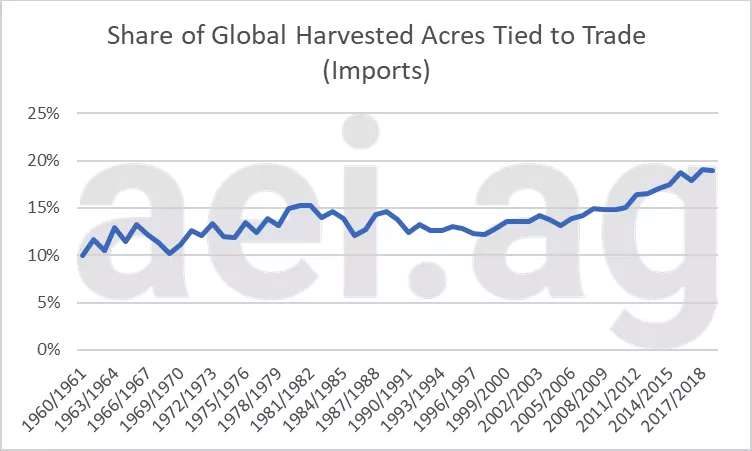
As we’ve written about in earlier posts, the world harvested more than 2.3 billion acres in the 2018/2019 marketing years. If you aggregate the total acres accounted for by those 13 crops shown in Figure 1 you find that 440 million acres, or 19% of the harvested acres, in the world were used as imports in the 2018/19 marketing year. What is perhaps more interesting is how this proportion has changed over time.
Figure 2 shows this measure – the share of global harvested acres tied to trade (imports)- over time. Global trade has required about 10% to 15% of harvested acres throughout much of modern history. Trade trended higher in the 1960s and 1970s before peaking at 15% in the early 1980s. It then fell into the 1990s when the measure reached 12% in 1997/1998. Since then, however, reliance on trade has turned higher, exceeded 1980s levels.

Figure 2. Share of Global Harvested Acres Tied to Trade for the Thirteen Primary Crops, 1960/1961 to 2018/2019.
Based on the measure of acreage used to satisfy trade needs, the world has become more reliant on international ag trade and this has grown in recent years. The growth has been driven largely by 3 crops. Soybeans accounted for much of the growth trade since 2000/2001 and represented 45% of the increased in trade-reliant harvested acres. Wheat (20% of growth) and corn (17% of growth) were also large contributors to the growth in trade.
Wrapping it Up
There are many ways to consider the magnitude of global trade. This post attempted to look at the magnitude of trade across thirteen key crops. When considering the magnitude of global trade on an acre-basis, a few key observations emerged. First, reliance on trade varies across crops (figure 1). Today, soybeans most reliant on global trade with 43% of production traded.
The second observation is – when considering trade impact on an acre equivalence across all crops- the world has become more reliant on trade over the last two decades. In fact, a larger share of harvested acres relies on trade today than in the past six decades. Most of the growth in the reliance on trade has come from soybeans (45%). Furthermore, the bulk of trade-reliant acres is soybean, wheat, and corn. These three are all key U.S. crops thereby making U.S. producers very dependent upon the international ag trade. For many years this has been a good bet.
The recent uptick in global acres reliant on trade also puts some perspective China’s growth in soybean consumption. This growth has spurred an uptick in our measure of international ag trade. Looking ahead, one has to wonder about the implications of the trade war and where this trend goes over the next 10 or 15 year. Will trade remain at current levels? Continue higher? Or drift lower toward the long-run level of 10% to 15%?
Interested in learning more? Follow AEI’s Weekly Insights by clicking here. Also, follow AEI on Twitter and Facebook.
[1] The 13 primary crops are: barley, corn, cotton, millet, oats, peanuts, rapeseed, soybeans, sunflowers, rice (milled), rye, sorghum, wheat.
Source: David Widmar, Agricultural Economic Insights

