Fertilizer Costs in 2017 and 2018
 Fertilizer prices have fallen in recent years, leading to lower fertilizer costs, major costs of producing corn and soybeans that have declined the most since the commodity price declines in 2013. In central Illinois, fertilizer costs for corn fell from $200 per acre in 2012 to $154 per acre in 2016. A further $20 per acre decrease is expected for 2017. Further reductions in 2018 are possible but may require farmers to reevaluate application decisions.
Fertilizer Prices
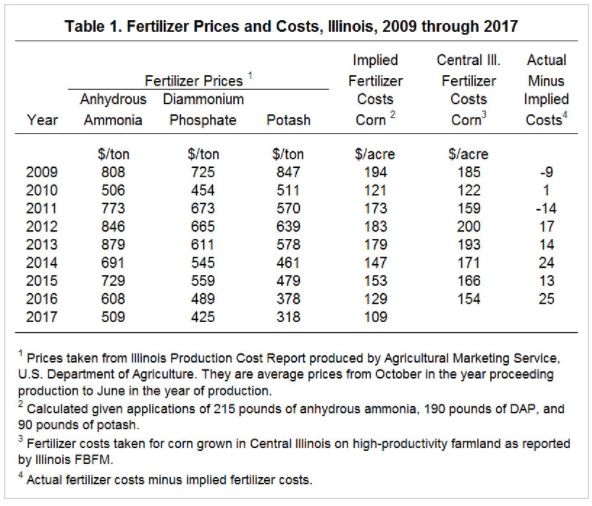
Table 1 shows fertilizer prices for anhydrous ammonia, diammonium phosphate (DAP) and potash as summarized from data of the Agricultural Marketing Service (AMS), an agency of the U.S. Department of Agriculture. AMS reports prices on a bi-weekly basis. Prices summarized in Table 1 are averages of those bi-weekly prices from October of the year preceding production through June of the year of production. For example, the 2017 anhydrous ammonia price of $509 per acre represents the average of the weekly prices from October 2016 through June of 2017.

In 2017, anhydrous ammonia prices averaged $509 per ton. The 2017 price was the lowest since 2009, the first year for which complete pricing data is available from AMS. From 2009 to 2017, anhydrous ammonia prices were the highest in 2013 with an average of $879 per ton. The 2017 price is 42% below the 2013 high. The 2017 price also is $99 per ton lower than the $608 per ton average for 2016.
In 2017, DAP prices averaged $425 per ton. Similar to anhydrous ammonia, the 2017 DAP average price was the lowest since 2009. From 2009 to 2017, the higher DAP price was $725 per ton in 2009. The 2017 price is 70% below the $725 per ton high. The 2017 price also is $64 below the $489 average price for 2016.
In 2017, potash prices averaged $318 per ton, the lowest average price since 2009. During the 2009 to 2017 period, potash had the highest average price of $847 per ton in 2009. The 2017 price is 166% below the 2009 price. The 2017 price is $60 lower than the 2016 price of $378 per ton.
Implied Fertilizer Costs
Given lower prices in 2017, fertilizer costs should be down as well. Actual fertilizer costs on farms have not been summarized year. As a result, fertilizer costs are implied to gauge possible decreases. Implied per acre costs are calculated for corn grown in central Illinois having an expected yield of 200 bushels per acre with fertilizer applied at rates from agronomic recommendations. Nitrogen recommendations are taken from the online Corn Nitrogen Rate Calculator. Phosphorus and potassium are taken from maintenance levels reported in Chapter 8 of the Illinois Agronomy Handbook.
Implied fertilizer costs are shown in Table 1. In 2017, implied fertilizer costs were $109 per acre for 2017 (see Table 1), down by $20 per acre from the 2016 level of $129 per acre, suggesting that 2017 fertilizer costs will be lower than 2016 costs.
Implied and Actual Fertilizer Costs
Actual fertilizer costs for corn grown on high-productivity farmland in central Illinois also are reported in Table 1. These costs represent summaries from farms enrolled in Illinois Farm Business Farm Management (FBFM). In the past five-years, farms within this category had average corn yields of 196 bushels per acre.
Implied and actual fertilizer costs follow each other closely but are not exact. Moreover, there is a trend to the discrepancies. Between 2009 and 2011, actual fertilizer costs were at or below implied fertilizer costs. Actual minus implied fertilizer costs were -$9 per acre in 2009, $1 in 2010, and -$14 per acre in 2011. The difference became positive in recent years: $17 in 2012, $14 in 2013, $24 in 2014, $13 in 2015, and $25 in 2016.
One would expect actual costs to be above implied costs for three reasons. First, fertilizer costs in FBFM include lime costs while the implied costs do not. Second, anhydrous ammonia is used to price nitrogen and many farms will use nitrogen solutions and urea for all or a part their nitrogen applications. Third, nitrogen inhibitors are not included in maintenance levels. Per pound of actual nitrogen applied, nitrogen solutions and urea will have higher costs per pound of nitrogen applied compared to nitrogen solutions and urea (farmdoc daily, April 5, 2016).
While actual costs would be expected to be higher than implied costs, the growing divergence is problematic. It suggests that fertilizer rates are increasing relative to 2009 to 2011 levels. Further reductions in fertilizer costs may be possible with rate decreases. Focus on phosphorus and potassium fertilizers may be warranted, making sure that soil test levels are not above those needed to maintain yields. Reduction in nitrogen rates also may be possible.
Outlook for 2018
From a farmer perspective, there is some optimism that fertilizer prices will hold or move down from 2017 levels. Futures prices on natural gas contracts are not suggesting large increases in natural gas, a major cost component of nitrogen fertilizer. DAP prices have been decreasing slightly in recent months. If not from further price decreases, fertilizer costs could still be reduced by reducing rates. Setting a 2018 fertilizer budget value for corn of $120 per acre may be realistic.
References
Corn Nitrogen Rate Calculator. Agronomy Extension and Outreach, Iowa State University, 2017. http://cnrc.agron.iastate.edu/
Fernández, F., and R. Hoeft. “Managing Soil pH and Crop Nutrients.” In Illinois Agronomy Handbook, Chapter 8, 91-112. Crop Science Extension & Outreach, accessed July 11, 2017. http://extension.cropsciences.illinois.edu/handbook/pdfs/chapter08.pdf
Schnitkey, G. “Averages and Seasonality of Prices for Nitrogen Fertilizers.” farmdoc daily (6):65, Department of Agricultural and Consumer Economics, University of Illinois at Urbana-Champaign, April 5, 2016.
Source: Gary Schnitkey, Farmdocdaily
