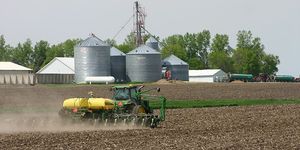
Corn Planting Falls Further Behind Average Pace
 U.S. corn planting equaled last year’s pace as of Sunday, April 28, but fell further behind the five-year average, according to USDA NASS’ weekly Crop Progress report on Monday.
As of Sunday, 15% of the nation’s corn was planted, equal to 15% at the same time last year but 12 percentage points behind the five-year average of 27%. In last week’s report, corn planting was 6 percentage points behind the average.
“Noticeable progress was made in Missouri, Iowa, Nebraska and Kansas,” noted DTN Lead Analyst Todd Hultman. “Minnesota, Indiana, Michigan and Ohio are all 2% planted, and South Dakota has yet to start.”
Corn emerged, reported by NASS for the first time this season, was estimated at 3%, also equal to last year but slightly behind the five-year average of 5%.
Soybean planting was estimated at 3% as of April 28, down from last year’s 5% and also below the five-year average of 6%. Planting was still mainly taking place in the Southern states.
Like corn, spring wheat planting also fell further behind the five-year average. NASS estimated that 13% of spring wheat was planted as of Sunday, 20 percentage points behind the five-year average of 33%. In last week’s report, planting was 17 percentage points below the five-year average. Idaho and Washington are past the halfway mark and lead the planting effort, while progress in the Dakotas and Minnesota is still in the single digits.
Winter wheat progress came in at 19% headed as of Sunday, near last year’s 18% but down 10 percentage points from the five-year average of 29%.
Meanwhile, winter wheat condition continued to improve. NASS estimated 64% of winter wheat was in good-to-excellent condition, up 2 percentage points from the previous week. Fifty-eight percent of Kansas winter wheat was considered in good-to-excellent condition.
“States in the eastern Midwest show poor-to-very-poor ratings in the double digits,” Hultman noted.
Sorghum was 20% planted, compared to 26% last year and a 25% five-year average. Cotton planting was 11% complete, compared to 12% last year and a 13% average. Rice was 38% planted, compared to 54% last year and a 57% average. Twenty-seven percent of rice was emerged, compared to 28% last year and an average of 37%.
Oats were 43% planted as of April 28, compared to 38% last year and a 61% average. Oats emerged were at 31%, compared to 29% last year and a 41% average.
To view weekly crop progress reports issued by National Ag Statistics Service offices in individual states, visit http://www.nass.usda.gov. Look for the U.S. map in the “Find Data and Reports by” section and choose the state you wish to view in the drop-down menu. Then look for that state’s “Crop Progress & Condition” report.
| National Crop Progress Summary | ||||
| This | Last | Last | 5-Year | |
| Week | Week | Year | Avg. | |
| Corn Planted | 15 | 6 | 15 | 27 |
| Corn Emerged | 3 | NA | 3 | 5 |
| Soybeans Planted | 3 | 1 | 5 | 6 |
| Winter Wheat Headed | 19 | 9 | 18 | 29 |
| Spring Wheat Planted | 13 | 5 | 9 | 33 |
| Cotton Planted | 11 | 9 | 12 | 13 |
| Sorghum Planted | 20 | 17 | 26 | 25 |
| Barley Planted | 28 | 17 | 24 | 41 |
| Barley Emerged | 6 | 2 | 6 | 15 |
| Oats Planted | 43 | 36 | 38 | 61 |
| Oats Emerged | 31 | 27 | 29 | 41 |
| Rice Planted | 38 | 31 | 54 | 57 |
| Rice Emerged | 27 | 18 | 28 | 37 |
**
| National Crop Condition Summary | |||||||||||||||||
| (VP=Very Poor; P=Poor; F=Fair; G=Good; E=Excellent) | |||||||||||||||||
| This Week | Last Week | Last Year | |||||||||||||||
| VP | P | F | G | E | VP | P | F | G | E | VP | P | F | G | E | |||
| Winter Wheat | 2 | 6 | 28 | 49 | 15 | 2 | 6 | 30 | 48 | 14 | 16 | 21 | 30 | 26 | 7 | ||
Anthony Greder can be reached at anthony.greder@dtn.com
Follow him on Twitter @AGrederDTN
Source: Anthony Greder, DTN
