Direct Farm Payments to Soar in 2020
The USDA recently announced the Coronavirus Food Assistance Program (CFAP). Like MFP, this is another ad hoc farm program that will send direct farm payments sharply higher. This week’s post is a review of direct farm payments and a look at what might be in store for 2020.
Direct Payments
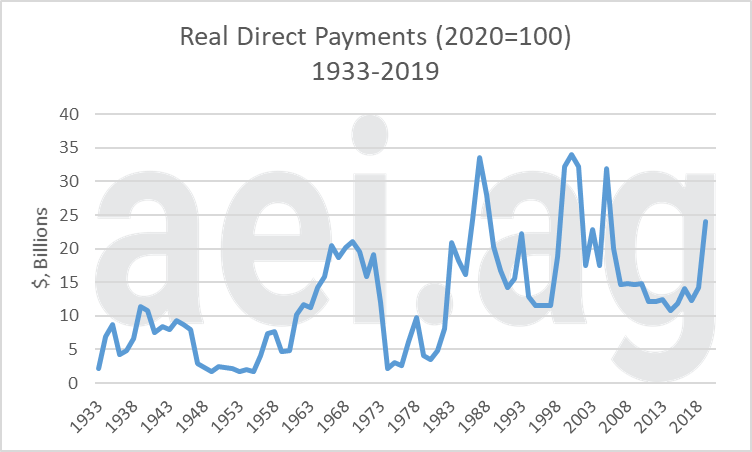
Figure 1 shows inflation-adjusted direct farm payments since 1933 (2020 dollars). While the jump in direct payments in 2019 grabbed a lot of attention, context is always important.
The first point to keep in mind is there is a base-level of program payments between $10-$15 billion. Before the trade war, ARC, PLC, and conservation programs accounted for most of the dollars spent. At roughly $4 billion annually, conservation spending was the largest category in the USDA’s February estimate for 2020, edging out combined spending on ARC and PLC.
If you really want to dig into direct payments over time, you should consider net government transfers. One way of thinking about direct payments is they act as a mechanism for offsetting a portion of the local and state-level property taxes producers face.
The second point to consider is that direct payments have typically increased during challenging times in the farm economy. Most notably, in the late 1980s, late 1990s, and early 2000s, direct payments exceeded $30 billion. Most recently, direct payments were $14 billion in 2018 and $24 billion in 2019.

Figure 1. Real Direct Farm Payments, 1933-2019 (2020-100). Data Source: USDA ERS.
Share of Farm Income
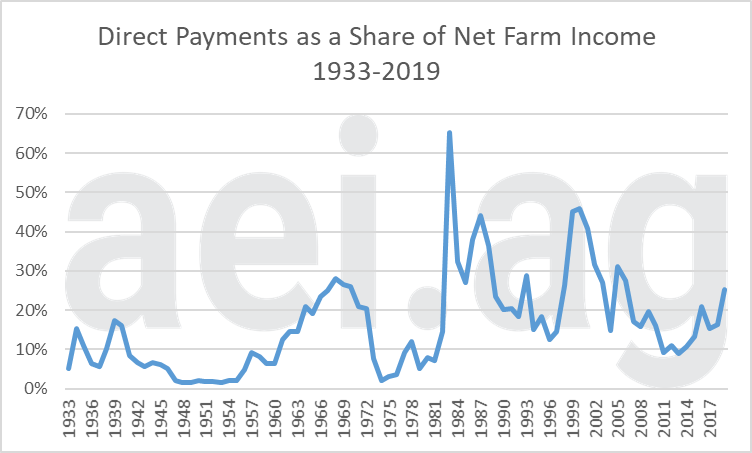
Another way of considering direct payments is as a share of net farm income (figure 2). In 1983, direct payments accounting for 65% of net farm income. It should be noted that net farm income in 1983 was at rock bottom, and direct payments approached what were, for that time, historic highs. Between 1983 and 1993, direct payments accounted for an average of 32% of net farm income.
In 2019, direct payment accounted for 25% of net farm income. Just a few years earlier, direct payment reached 21% of income in 2016 when income slumped and ARC/PLC payments jumped.
We previously noted producers should keep a similar measure in mind for their operation. MFP payments – while helpful- were ad hoc and not guaranteed in upcoming years. This made it important to consider the magnitude of such payments when evaluating financial performance in 2018 and 2019. As we look ahead, this will likely be an important consideration for producers in 2020 as well.

Figure 2. Direct Farm Payments as a Share of Net Farm Income, 1933-2019 (2020-100). Data Source: USDA ERS and aei.ag Calculations.
Looking Ahead
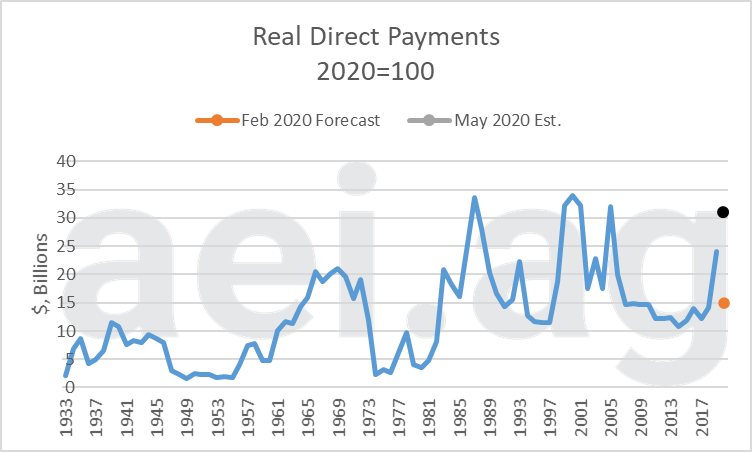
In February, the USDA estimated $14.98 billion in direct payments to producers in 2020. This figure included $3.6 billion in MFP payment from 2019 production that was paid in 2020 (the final 25% paid in early January).
In May, the USDA’s CFAP announcement noted $16 billion would be direct payments. A large share of CFAP funding would go to livestock producers, who were mostly left out of MFP payments. Of note, about $5 billion went to cattle producers, and $3.5 billion went to row crop producers (here and here).
Figure 3 shows direct payments over time, along with estimates for 2020. The first 2020 estimate, in orange, is the USDA’s February value. This now-outdated estimate would have represented a sharp decline from 2019, but a return to normal. In black is our May 2020 estimate of $30.98 billion (the USDA’s Feb. estimate of $14.98b + $16b from CFAP). This is to say that all signs point to direct payments in 2020 approaching record levels.
That said, there are three considerations to keep in mind. First, ARC and PLC payments made in 2020 (for 2019 production) could increase from the initial February estimates. While a majority of 2019/2020 market year crops were sold before prices fell, some adjustments are likely (this farmdoc article outlines some estimates). Second, the CARES act is set to replenish the USDA’s CCC account with $14 billion in July. It’s unclear how this money will be used, but that money could be spent for additional direct payments (this farmdoc article outlines in more detail). Finally, there could be further legislative action. For example, there have been calls to increase the CCC’s line of credit, and the House-passed HEROES Act included some $16 billion in additional direct payment funds.
The USDA’s next update of these data will be in August. Between now and then, it’s possible for some combination of Congressional and/or administrative action to results in new or expanded programs. To that point, keep in mind that the May CFAP program did not include support for row crops raised in 2020.

Figure 3. Real Direct Farm Payments, 1933-2019 (2020-100). Estimated 2020 Payments (black and orange). Data Source: USDA ERS.
Wrapping it Up
We are not interested in debating the pros and cons of government support in agriculture here. Furthermore, we are not arguing what an appropriate level of funding in 2020 should be. However, it’s important to describe the facts of the situation. Direct farm payments have been an important source of financial support for farmers over the years, and these payments have typically increased during times of farm financial stress. In 2020, direct payments are positioned to increase significantly, with additional programs and payments still possible. The possibility of direct payments hitting – or even exceeding- historic highs underscores the challenges facing an already precarious farm economy.
Click here to subscribe to AEI’s Weekly Insights email and receive our free, in-depth articles in your inbox every Monday morning.
You can also click here to visit the archive of articles – hundreds of them – and to browse by topic. We hope you will continue the conversation with us on Twitter and Facebook.
Bonus: The topic of direct payments in 2020 is something we’ve been following closely within AEI Premium. We’ve even added an AFN question about this specifically: “What is the probability of direct farm payments in 2020 exceeding $40 billion?” Below is a video that summarizes my forecast, and the current AFN Consensus. Update your forecast, or get started.
Source: David Widmar, Agricultural Economic Insights
