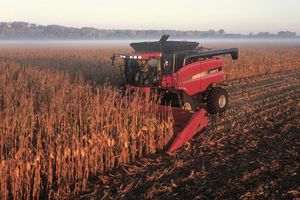
Corn Harvest Hits Halfway Point-Still Second-Slowest Pace in Past 20 Years
 The U.S. corn harvest finally hit the halfway point last week while the soybean harvest was about three-quarters complete as of Sunday, Nov. 3, according to USDA NASS’ latest Crop Progress report released Monday.
Nationwide, corn harvest progressed another 11 percentage points last week to reach 52% as of Sunday, 23 percentage points behind the five-year average of 75%. That was further behind the average pace than the previous week when harvest was running 20 percentage points behind the five-year average.
“The percent of corn harvested was less than expected and is still the second-slowest harvest pace of the past 20 years, second only to 2009,” said DTN Lead Analyst Todd Hultman. “It is no surprise that Northern states remain well behind their five-year averages, but Iowa also remains slow, at 43% harvested versus a five-year average of 72%.”
Meanwhile, soybean harvest moved ahead 13 percentage points last week to reach 75% as of Sunday. That was 12 percentage points behind the five-year average of 87%, an improvement from last Monday’s report, when harvest was running 16 percentage points behind average.
“Soybean harvest progress was in line with expectations and also the slowest progress since 2009,” Hultman said. “Nebraska leads major soybean-producing states with 94% of harvest complete. Iowa and Illinois are 80% and 77% finished, respectively.”
Winter wheat progress maintained a near-normal pace last week. As of Sunday, 89% of winter wheat was planted, slightly ahead of the five-year average of 88%. Winter wheat emerged was estimated at 71%, just slightly behind the five-year average of 74%.
Winter wheat condition was estimated at 57% good to excellent, up 1 percentage point from 56% the previous week.
Sorghum harvested reached 78%, ahead of the five-year average of 72%. Cotton harvested was estimated at 53%, also ahead of the average pace of 51%.
To view weekly crop progress reports issued by National Ag Statistics Service offices in individual states, visit http://www.nass.usda.gov/…. Look for the U.S. map in the “Find Data and Reports by” section and choose the state you wish to view in the drop-down menu. Then look for that state’s “Crop Progress & Condition” report.
| National Crop Progress Summary | ||||
| This | Last | Last | 5-Year | |
| Week | Week | Year | Avg. | |
| Corn Mature | 96 | 93 | 100 | 100 |
| Corn Harvested | 52 | 41 | 74 | 75 |
| Soybeans Harvested | 75 | 62 | 81 | 87 |
| Winter Wheat Planted | 89 | 85 | 83 | 88 |
| Winter Wheat Emerged | 71 | 63 | 69 | 74 |
| Cotton Harvested | 53 | 46 | 48 | 51 |
| Sorghum Harvested | 78 | 65 | 62 | 72 |
**
| National Crop Condition Summary | |||||||||||||||
| (VP = Very Poor; P = Poor; F = Fair; G = Good; E = Excellent) | |||||||||||||||
| This Week | Last Week | Last Year | |||||||||||||
| VP | P | F | G | E | VP | P | F | G | E | VP | P | F | G | E | |
| Corn | 3 | 10 | 29 | 47 | 11 | 3 | 9 | 30 | 47 | 11 | 4 | 8 | 20 | 48 | 20 |
| Winter Wheat | 4 | 9 | 30 | 45 | 12 | 4 | 9 | 31 | 44 | 12 | 3 | 9 | 37 | 42 | 9 |
**
| National Soil Moisture Condition – 48 States | ||||||||||||
| (VS = Very Short; SH = Short; AD = Adequate; SR = Surplus) | ||||||||||||
| This Week | Last Week | Last Year | ||||||||||
| VS | SH | AD | SR | VS | SH | AD | SR | VS | SH | AD | SR | |
| Topsoil Moisture | 5 | 11 | 63 | 21 | 6 | 13 | 62 | 19 | 4 | 8 | 66 | 22 |
| Subsoil Moisture | 5 | 14 | 65 | 16 | 7 | 15 | 63 | 15 | 5 | 12 | 67 | 16 |
Anthony Greder can be reached at anthony.greder@dtn.com
Follow him on Twitter @AGrederDTN
Source: Anthony Greder, DTN
