Farm Property Taxes-A Geographical Look
Last week’s post was a look at the trends in farm property tax expenses. Consistent with what producers have been telling us, property tax expenses in recent years has been historically high by a couple of different measures. Of course, making the situation more challenging has been declining farm income. This week’s post considers how trends in farm property taxes have varied by state.
Change in Farm Property Tax Expense
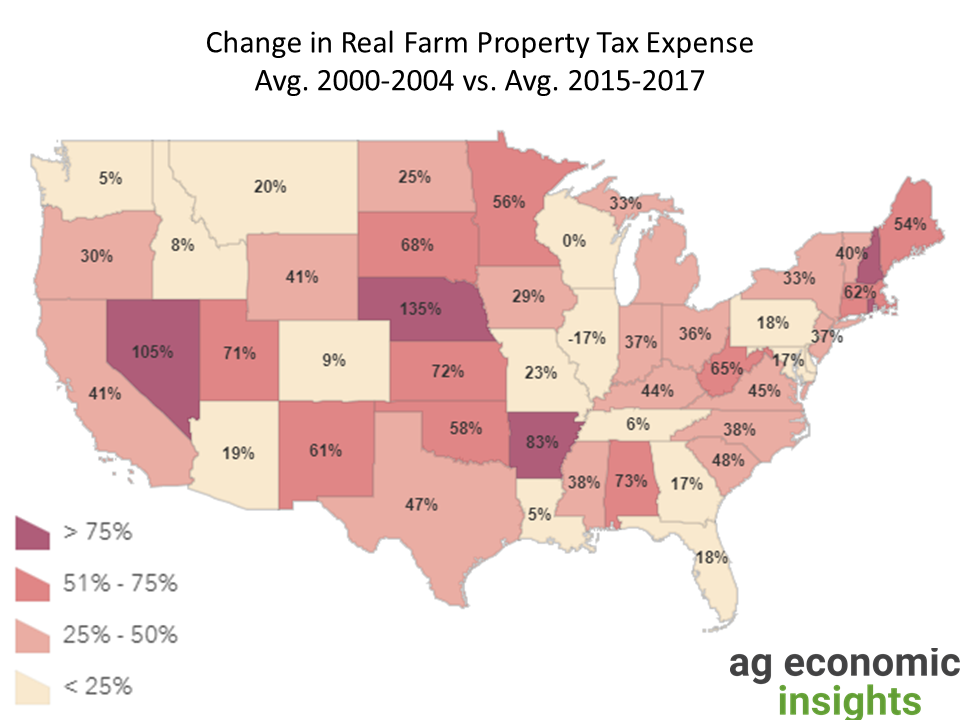
As we saw in the previous post, property tax expense turned higher in the mid-2000s. Figure 1 shows how state-level changes in farm property expense have played out. Specifically, this map shows how the change between the early 2000s (average of 2000-2004) compared to recent years (average of 2015-2017). To clarify, these changes are for inflation-adjusted dollars and, unfortunately, 2017 is the most recent data for these USDA state-level estimates.
The first observation is that changes in farm property tax expense have varied significantly across states. Some states experienced large -almost unbelievable- increases: Nebraska (+135%), Nevada (+105%), Arkansas (+83%). Remember, a 100% increase is doubling the expense. On the other hand, some states saw little change. Real property tax expenses were unchanged in Wisconsin, and actually lower in Illinois (-6%).
Broadly speaking, those hit hardest by higher property tax expenses were the Great Plains states. This makes some sense given farmland values jumped the most here. That said, some Great Plains states mostly escaped higher property tax expense. Consider North Dakota. Farmland values also soared in North Dakota – similar to what was observed in South Dakota and Nebraska. However, the change in property taxes was much smaller in North Dakota.
Nebraska stands out – a theme throughout this post. Changes in farm property expenses in Nebraska outpaced its neighbors dramatically. Colorado and Iowa observed very small changes, while Kansas and South Dakota had modest increases.

Figure 1. Change in Farm Property Tax Expense, by State. Average of 2000- 2004 vs. Average of 2015 – 2017. Data Source: USDA ERS and aei.ag Calculations.
Property Taxes relative to Value of Farm Production
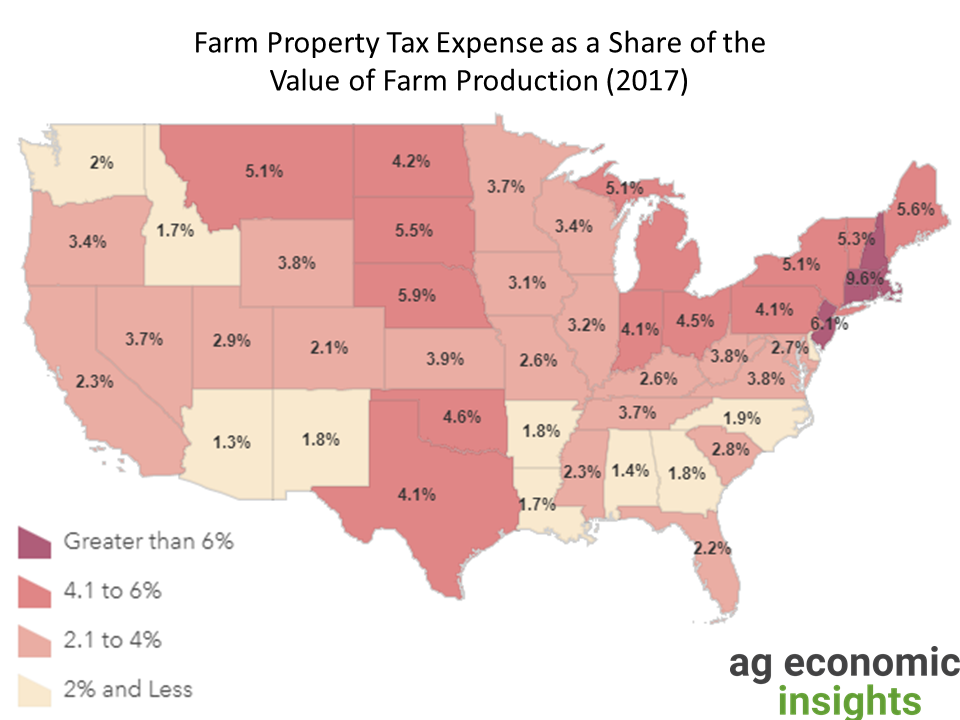
A second way of considering farm property taxes is relative to the value of farm production (VFP) (Figure 2). Last week’s post had a similar measure for national-level trends but considered property taxes relative to net farm income.
The first observation is a clustering of similar property tax expenses by neighboring states. The Northern Great Plains states are at levels about 4% of VFP. Meanwhile, the central Corn Belt States are at levels between 2% and 4%. The Eastern Corn belt and Northeast states again have higher rates. While there are wide differences across the U.S., one does not find a state that standout out as wildly higher (or lower) than its neighbors. It seems that state and county-level property taxes are driven, in part, by what neighbor states are facing.
That said, Nebraska, again, stands out. Property taxes expense in 2017 accounted for 5.9% of the value of farm production. Said differently, property taxes expense was $6 for every $100 in value of production. This is the highest levels seen throughout the entire Midwest. Similarly, neighboring state South Dakota is also high at 5.5%. These levels are nearly double what producers in Missouri and Iowa faced. In fact, you have to get to the Northeast to find higher relative property taxes. For every $100 of ag value produced, those in Nebraska have a higher property tax expense than producers in California or New York.
Outside of the Midwest, producers in the Southeast, Southwest, and Northwest, producers generally experienced lower relative property tax expense.

Figure 2. Farm Property Tax Expense as a Share of the Value of Farm Production, 2017. Data Source: USDA ERS and aei.ag Calculations.
Relative to Direct Payments
In the previous post, the relationship between property tax expenses and the direct payments producers received – net transfers – was considered. At the national level, these payments have been roughly equal at various times in history. In fact, in recent history (prior to 2019) producers paid slightly more in property taxes than they received from direct payments.
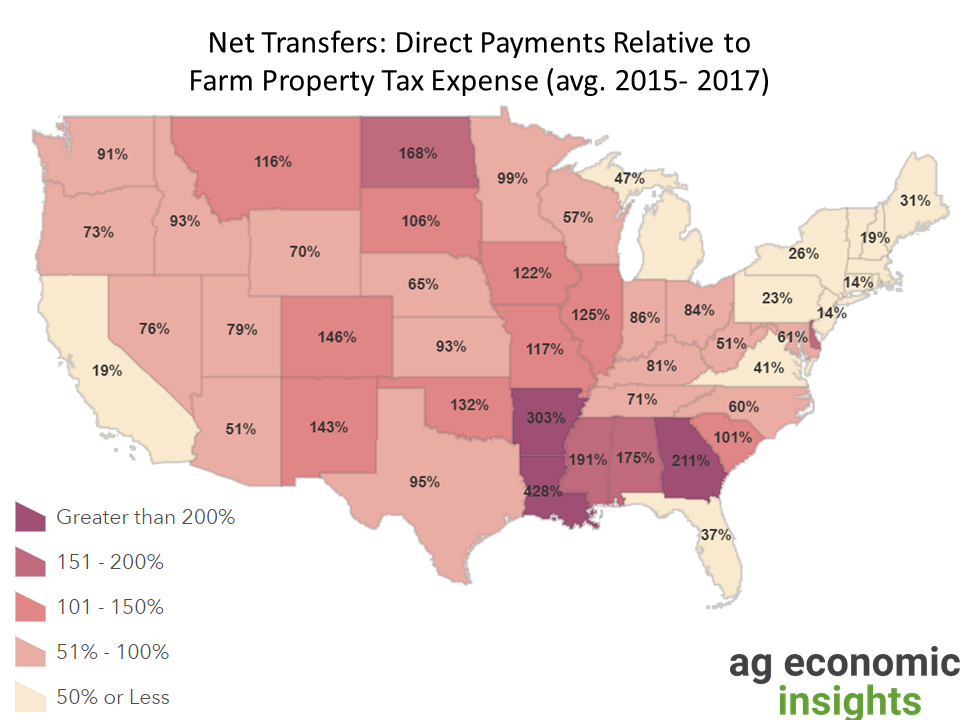
Figure 3 shows a measure for net transfers at the state level. Specifically, the average annual direct payment received between 2015 to 2017 was divided by the average annual property tax expense during the same period. Values over 100% mean producers received more direct payments than paid in property taxes. Conversely, values less than 100% is when the property tax expense exceeded direct payments received.
While these payments were roughly equal at the national-level during these years, net transfers at the state level are not roughly equally. Take North Dakota, for example. The relative measure in that state was 168% for the years considered, meaning direct payments received were much higher than the property taxes paid. Specifically, every $100 in property taxes paid was, effective, offset by $168 of direct payments received.
In South Dakota, the measure was nearly 100%. Further south, Nebraska producers faced higher property tax expense than the direct payments they received. With a relative measure at 65%, producers received $65 of direct payments for every $100 of property tax expense. This is a very different scenario than faced by North Dakota and South Dakota producers. It is also worth noting that Eastern Corn Belt producers have a similar situation to that in Nebraska, albeit to a lesser degree. In the Central Corn Belt states (IA, IL, MO), however, the measure higher is higher than 100%.
Outside of the Corn Belt, in the Southeast– where property taxes account for a smaller burden relative to the value of farm production (Figure 2)- producers have, at least in recent years, received direct payments much larger than the property taxes they face. In the Northeast, property taxes are much larger than government payments. In California- which has a low relative tax burden (figure 2) but also has less traditional direct payment crops- producer receives only $19 in direct payments for $100 in property tax expense.

Figure 3. Net Government Transfer: Direct Payments Divided by Farm Property Tax Expense (avg. 2015 – 2017). Data Source: USDA ERS.
Wrapping it Up
Following-up on the previous national-level look at trends in property tax expense, this week’s post found a wide variation in what has occurred at the state level. First, the change in property taxes since the early 2000s has ranged from +135% in Nebraska to -17% in Illinois.
Second, when you consider property tax expense relative to the value of ag production, variation also occurs. While states are often similar to their neighbors creating pockets, or clusters, of similar rates. However, these clusters can vary within a region. South Dakota and Nebraska have property tax expenses equal to more than 5% of the value of farm production. Meanwhile, the neighboring state of Minnesota, Iowa, Missouri, and Kansas all have substantially lower rates, below 4%.
Finally, the interaction between direct payment received and property tax expense – which had a notable relationship at the national level- is, again, highly variable at the state-level. Some states, especially in the Southeast, have experienced significantly more direct payments in recent years than paid in property taxes. Within the Corn Belt, Central Corn Belt states have received more direct payments than paid in property taxes, while Eastern Corn Belt producers have experienced the opposite.
In summary, the impact that property tax expense has on a producers budget and cash flows can be highly variable across the country. In fact, variability among neighboring state can even be quite large.
Moving forward, we’d expect the attention and concern about property tax expense will continue into the near future. Especially if net farm income remains stubbornly low. That said, the level of producer frustration – and pain- will be variable. Expect producers in Nebraska, South Dakota, and parts of the Eastern Corn Belt to look for relief.
Like what you read? Click here to subscribe to AEI’s Weekly Insights and receive our free, in-depth articles in your inbox every Monday morning.
But wait, there’s more: click here to visit the archive of our articles – hundreds of them – and to browse by topic. We hope you will continue the conversation with us on Twitter and Facebook.
Source: Brent Gloy and David Widmar, Agricultural Economic Insights
